Pairwise generated Interrelationship Diagraph
Pairwise generated Interrelationship Diagraph (PID) compared to traditional Interrelationship Digraph (ID)
Pairwise generated Interrelationship Diagraph (PID) is an enhanced version of the commonly used Interrelationship Diagraph (ID). The following points explain why PID is easier and better to use than the traditional ID.
- PID has a number of benefits over ID. It has better accuracy because the relationships are generated using the pairwise analysis process. This process creates focused discussion and analysis for better understanding of the relationship. The tedious job of keeping track of diagram details and connections is done by the software as a result many elements can be used compared to the traditional manual process. The software also provides a real time drawing of the Diagraph for analysis at any time - this saves time because the need for physically creating the chart is eliminated.
- An Interrelationship Digraph is used to analyze the cause and effect relationships that exist between ideas so that the key drivers and outcomes can be determined. An Interrelationship Digraph consists of circularly positioned ideas with arrows indicating the direction of influence of one idea upon another. Only the dominant direction of influence is drawn, therefore arrows pointing in both directions between ideas are not present in a traditional Interrelationship Digraph.(This limitation does not apply to PID)
- An Interrelationship Digraph is used to analyze the cause and effect relationships that exist between ideas so that the key drivers and outcomes can be determined. An Interrelationship Digraph consists of circularly positioned ideas with arrows indicating the direction of influence of one idea upon another. Only the dominant direction of influence is drawn, therefore arrows pointing in both directions between ideas are not present in a traditional Interrelationship Digraph.(This limitation does not apply to PID)
- An Interrelationship Digraph can be useful in combination with ISM, if the ISM contains many ideas with cyclic dependencies. For more detailed understanding of that section of the ISM, a separate Interrelationship Diagram can be constructed for those selected ideas. This will resurface the simplifying actions of ISM.
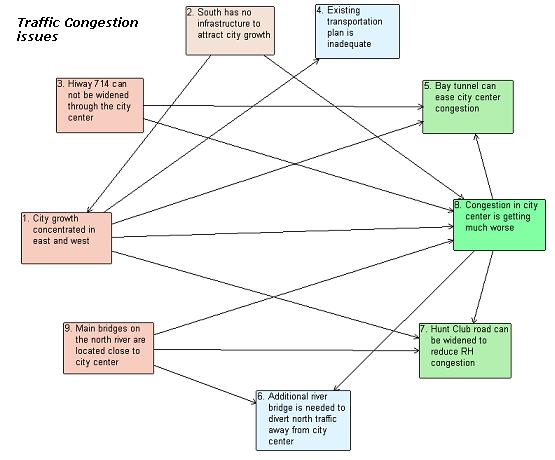
The following figure shows a PID generated using ConceptStar software.
Traditional method of creating an Interrelationship Digraph (ID)
The following steps show how a traditional ID is constructed. (PID does not require many of the steps described below due to computer assisted construction)
1. Define an issue or problem and collect the related ideas (5 to 25 ideas).
2. Write the ideas on cards in large letters and arrange them in a large circular pattern on a wall or other surface such that arrows can be easily drawn between them.
3. Work with one idea-pair at a time to determine the direction of the dominant influence and draw an arrow representing that influence. If the influence is deemed to be equal in both directions, the idea pair can be collapsed as one idea-set by putting the two cards together.
4. Work through all of the idea pairs to draw the influence arrows.
5. If there are a large number of ideas in the Interrelationship Digraph, select the ideas with the most in-arrows and out-arrows to construct a simpler final Interrelationship Digraph.
6. The ideas or issues with a large number of out-arrows are the root cause or drivers, and the ones with a large number of in-arrows are the outcomes.