Understanding Financial Statements
Many managers and employees have very little understanding of Financial Statements. In the following note we present an overview of profit and loss statements and balance sheets. It is intended for those who are not involved in accounting on a day to day basis. Most of the related terms are also described in the last pages. A real example is included.
Profit & Loss Statement
also called Income Statement or Statement of Revenue & Expenses
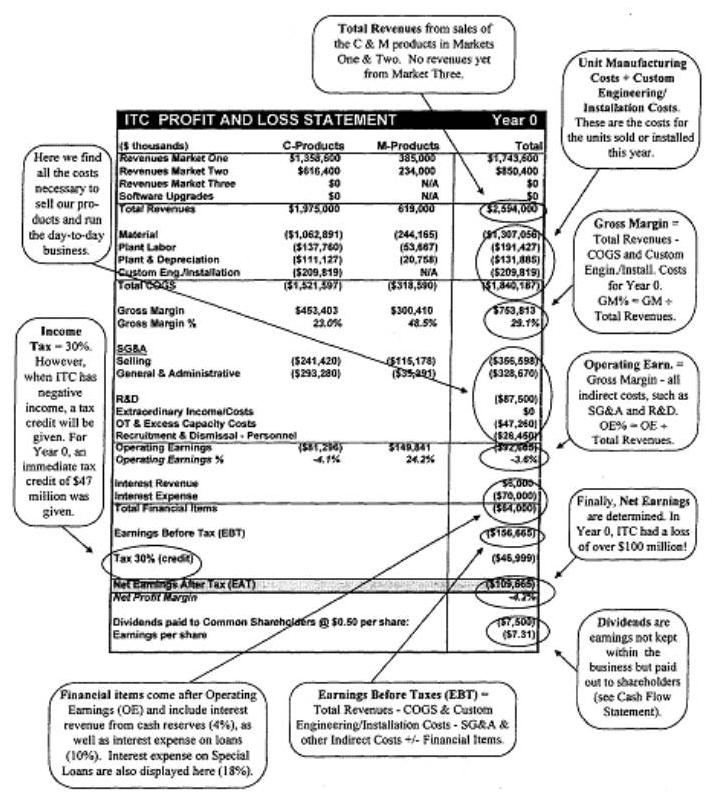
COGS = Cost Of Goods Sold
The Balance Sheet
This document compares Assets with Liabilities and Shareholders Equity at a given instant in time, for example December 31, year 0. Unlike the Profit & Loss Statement, which views a company over a certain time period, the Balance Sheet is more of a photographic image showing how that company looks on a particular day.
On ITC's Balance Sheet, you would see Assets on one side: cash, accounts receivable, inventories, and plant. On the Liabilities and Shareholders Equity side you would see: accounts payable and loans under Liabilities, and earnings plus information regarding ITC's shares under Shareholders Equity.
The Balance Sheet has its name because Assets must equal Liabilities + Shareholders Equity .
If a company receives a loan of $1,000 then that Loan would be inserted under Liabilities, accompanied by a $1,000 increase in cash under Assets. If we assume that the company manufactures $700 worth of products and none of them are sold, then you would see a $700 increase in inventories under Assets as well as a $700 decline in cash. If $400 worth of products had been sold then you would see a corresponding drop in inventory and an increase in cash or accounts receivable. This balance between the two sides is necessary to account for the funds a company receives and how that company spends those funds.
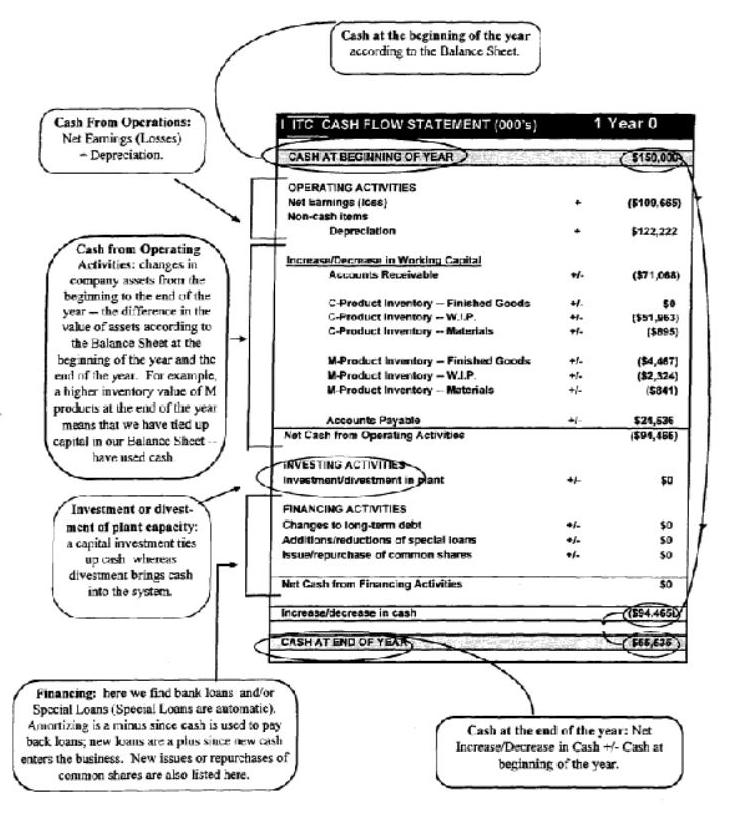
Cash Flow
The Cash Flow Statement is similar to the Profit & Loss Statement in that it measures a company's financial progress over a certain time period. However, here the emphasis is placed on how cash was used, in terms of both inflow and outflow. For example, if the company has less finished goods inventory at the end of the year compared to the beginning of the same year, then cash flow has increased. A simplified Cash Flow Statement is comprised of three major sections:
- Cash from Operating Activities
-
We take earnings (or losses) from operations and add back depreciation. We also incorporate changes in the Balance Sheet, where we compare the Balance Sheet at the beginning of the year with the Balance Sheet at the end of the year. Then we measure the changes which have taken place in materials, work in process, inventories, etc. A larger Balance Sheet at the end of the year means that we have "invested or spent" cash on assets.
- Cash from Investing Activities
-
We include cash outflows (or inflows) for investment (divestment) of plant.
- Cash from Financing Activities
-
We add cash received from new loans or subtract cash used to amortize old loans as well as incorporate the impact of issuing or repurchasing common shares.
Finally, what's left is Net Increase/Decrease in Cash and if we add this change in cash to the cash amount at the beginning of the year, we end up with our cash balance at the end of the year.
Key Ratios
Fnancial ratios allow us to analyze these three statements more closely to determine if the company is financially sound.
Let's examine two ratios which are vital to the interpretation of the Profit & Loss Statement.
Gross Margin (GM)
To arrive at the gross margin simply take total revenues (sales of C & M products in Markets One & Two -- and perhaps sales of C in Market Three?) and subtract the direct costs involved in manufacturing the products, or COGS as well as Custom Engineering/lnstallation Costs. For example:
(*numbers in thousands)
                Total Revenues = $2,594,000
                Cost of Goods Sold = $1,840,187
Then the Gross Margin = $2,594,000 - $1,840,187 = $753,813
This can also be expressed as a ratio by simply dividing gross margin by revenues:
Gross Margin% = $753,813 / $2,594,000 = 29.1%
Operating Earnings (0E)
To arrive at operating earnings, other costs such as administration, recruitment and dismissal, advertising and distribution, must be subtracted from the gross margin. These are necessary costs to run the business. To use our example, let’s say this cost group adds up to $846,478:
Gross margin was $753,813
So:
Operating Earnings = $753,813 - $846,478 = $(92,665)
Our Operating Earnings is now a negative $92,665. This can also be expressed as a ratio by dividing operating earnings by total revenues:
Operating Earnings = $(92,665) / $2,594,000 = -3.6%
Return On Assets (ROA)
Another very important ratio is Return on Assets (ROA). This ratio takes Operating Earnings + Interest Revenue and divides it by Total Assets. This clarifies how well we use our assets to generate profits:
Return on Assets = (Operating Earnings + Interest Revenue) / Total Assets
At the present time, ITC's Return on Assets is negative due to negative earnings = losses! To continue with the example above, let's take Operating Earnings of $(92,665) from above, Interest Revenue of $6000 from the Statement of Profit & Loss, and total assets of $2,207,917 from the Balance Sheet:
Return on Assets = (-$92,665 + $6000) / $2,207,917 = -3.9%
OTHER ISSUES
Cash available at the beginning of the year will yield an interest rate of 4%. The interest revenue will appear in the next year's Profit & Loss Statement and Cash Flow. It is calculated based on the cash balance at the beginning of the year.
Interest expense on bank loans starts at 10% on balances up to $800 million. After $800 million, the interest rate increases by 0.50% for each additional $100 million in loans. The interest is calculated based on the average loan balance according to the balance sheet at the beginning and the end of the year.
Interest expense on Special Loans is 18% and will be charged the year after the loans are incurred. Please note! All special loans transactions are automatic, i.e. new loans are "approved" when ITC faces a cash deficit, and are "amortized" as soon as ITC generates new cash.
An ITC can issue or buy back up to a maximum of 5 million shares.
Number of financial days per year in the simulation is 365.
Depreciation rate is 10% for the manufacturing plant.
Income tax rate is 30%. When ITC records negative earnings before taxes, as it did in year 0, a tax credit of 30% will be given in subsequent years.